SaaS: Event Log errors that I cannot trace back to their origin

September 1, 2024 10:44 AM

I am facing an issue where my site's Event Log in the local development environment is crystal clear with no errors. However, when deployed on the SaaS platform (Xperience Portal), I encounter errors that I cannot trace back to their origin, making it difficult to determine a potential fix. I have already reached out to the consulting team but haven't had much success. Therefore, I am turning to the community for advice on how to inspect these issues and find a solution.

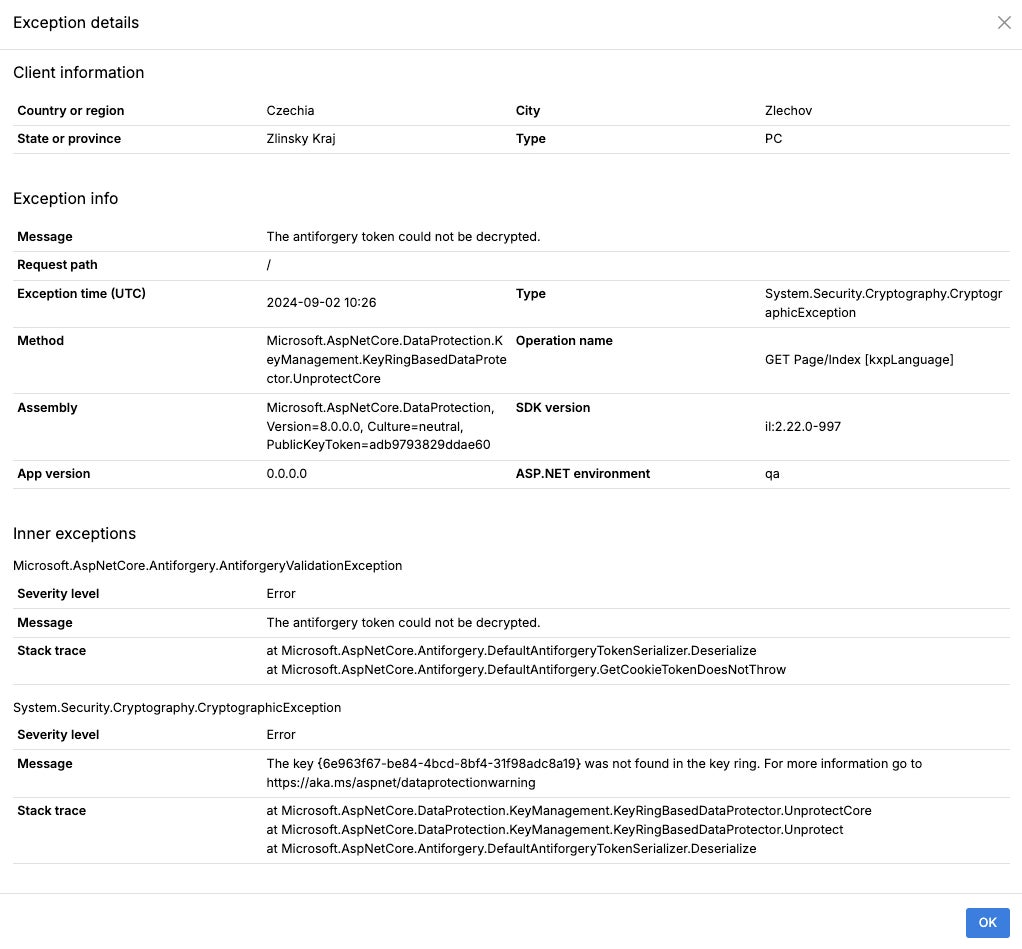
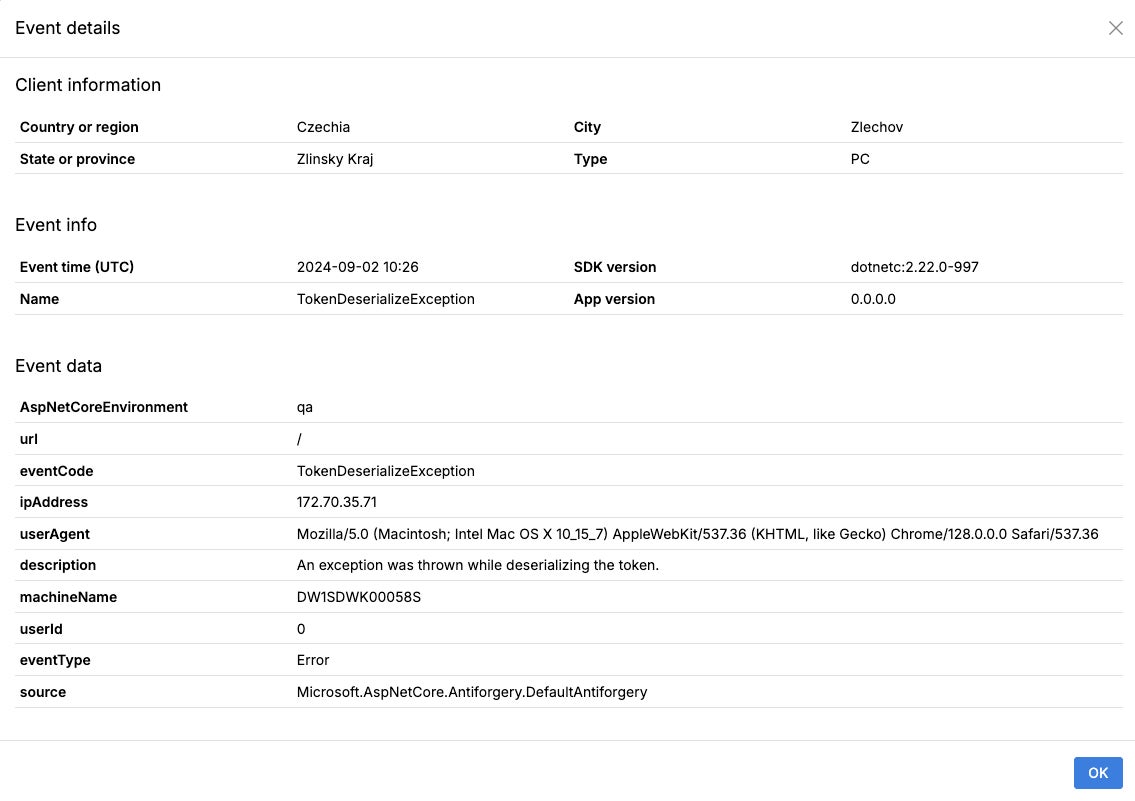
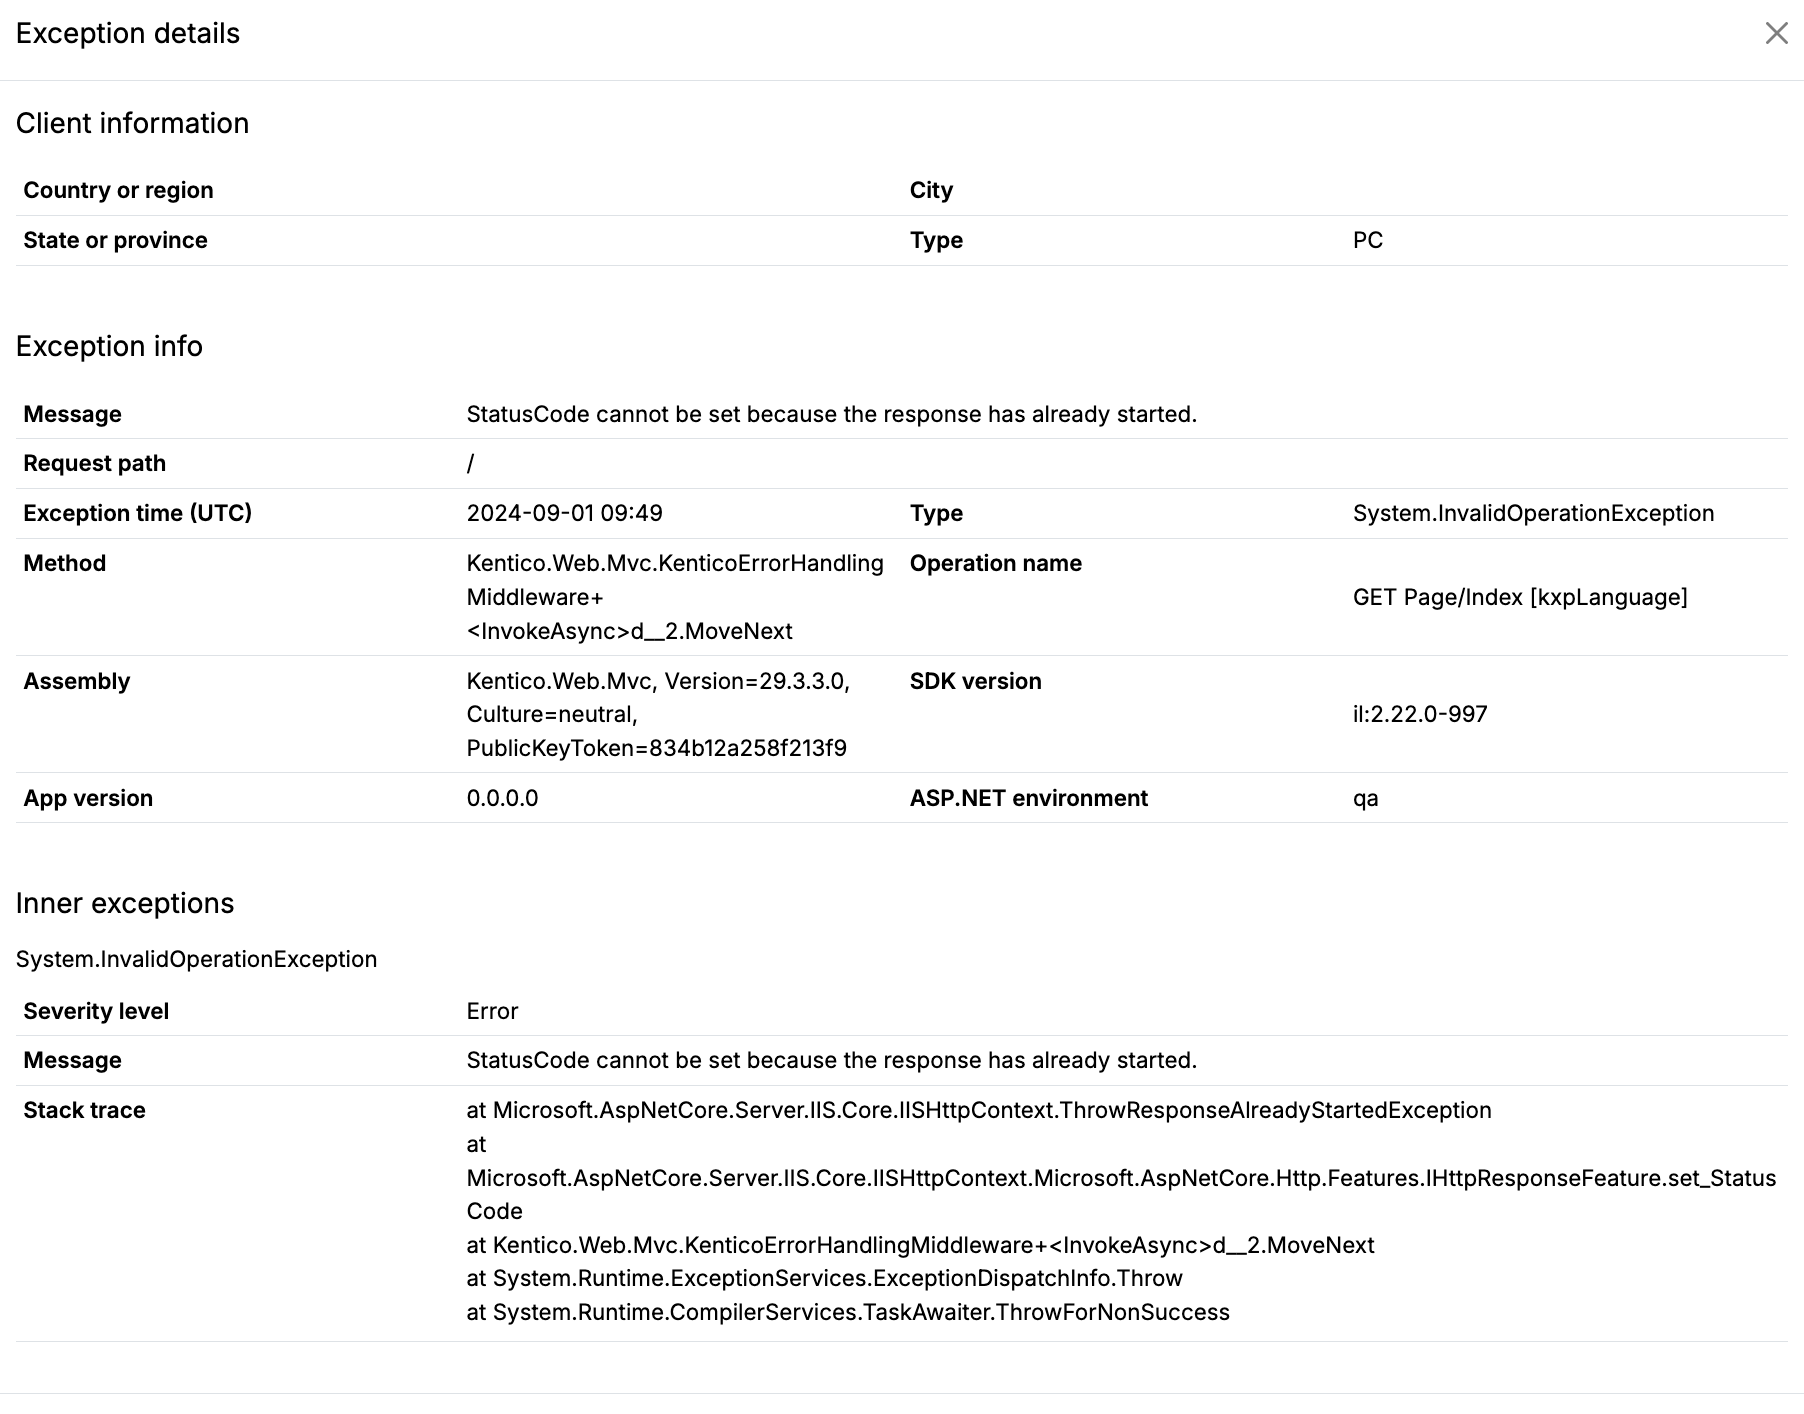
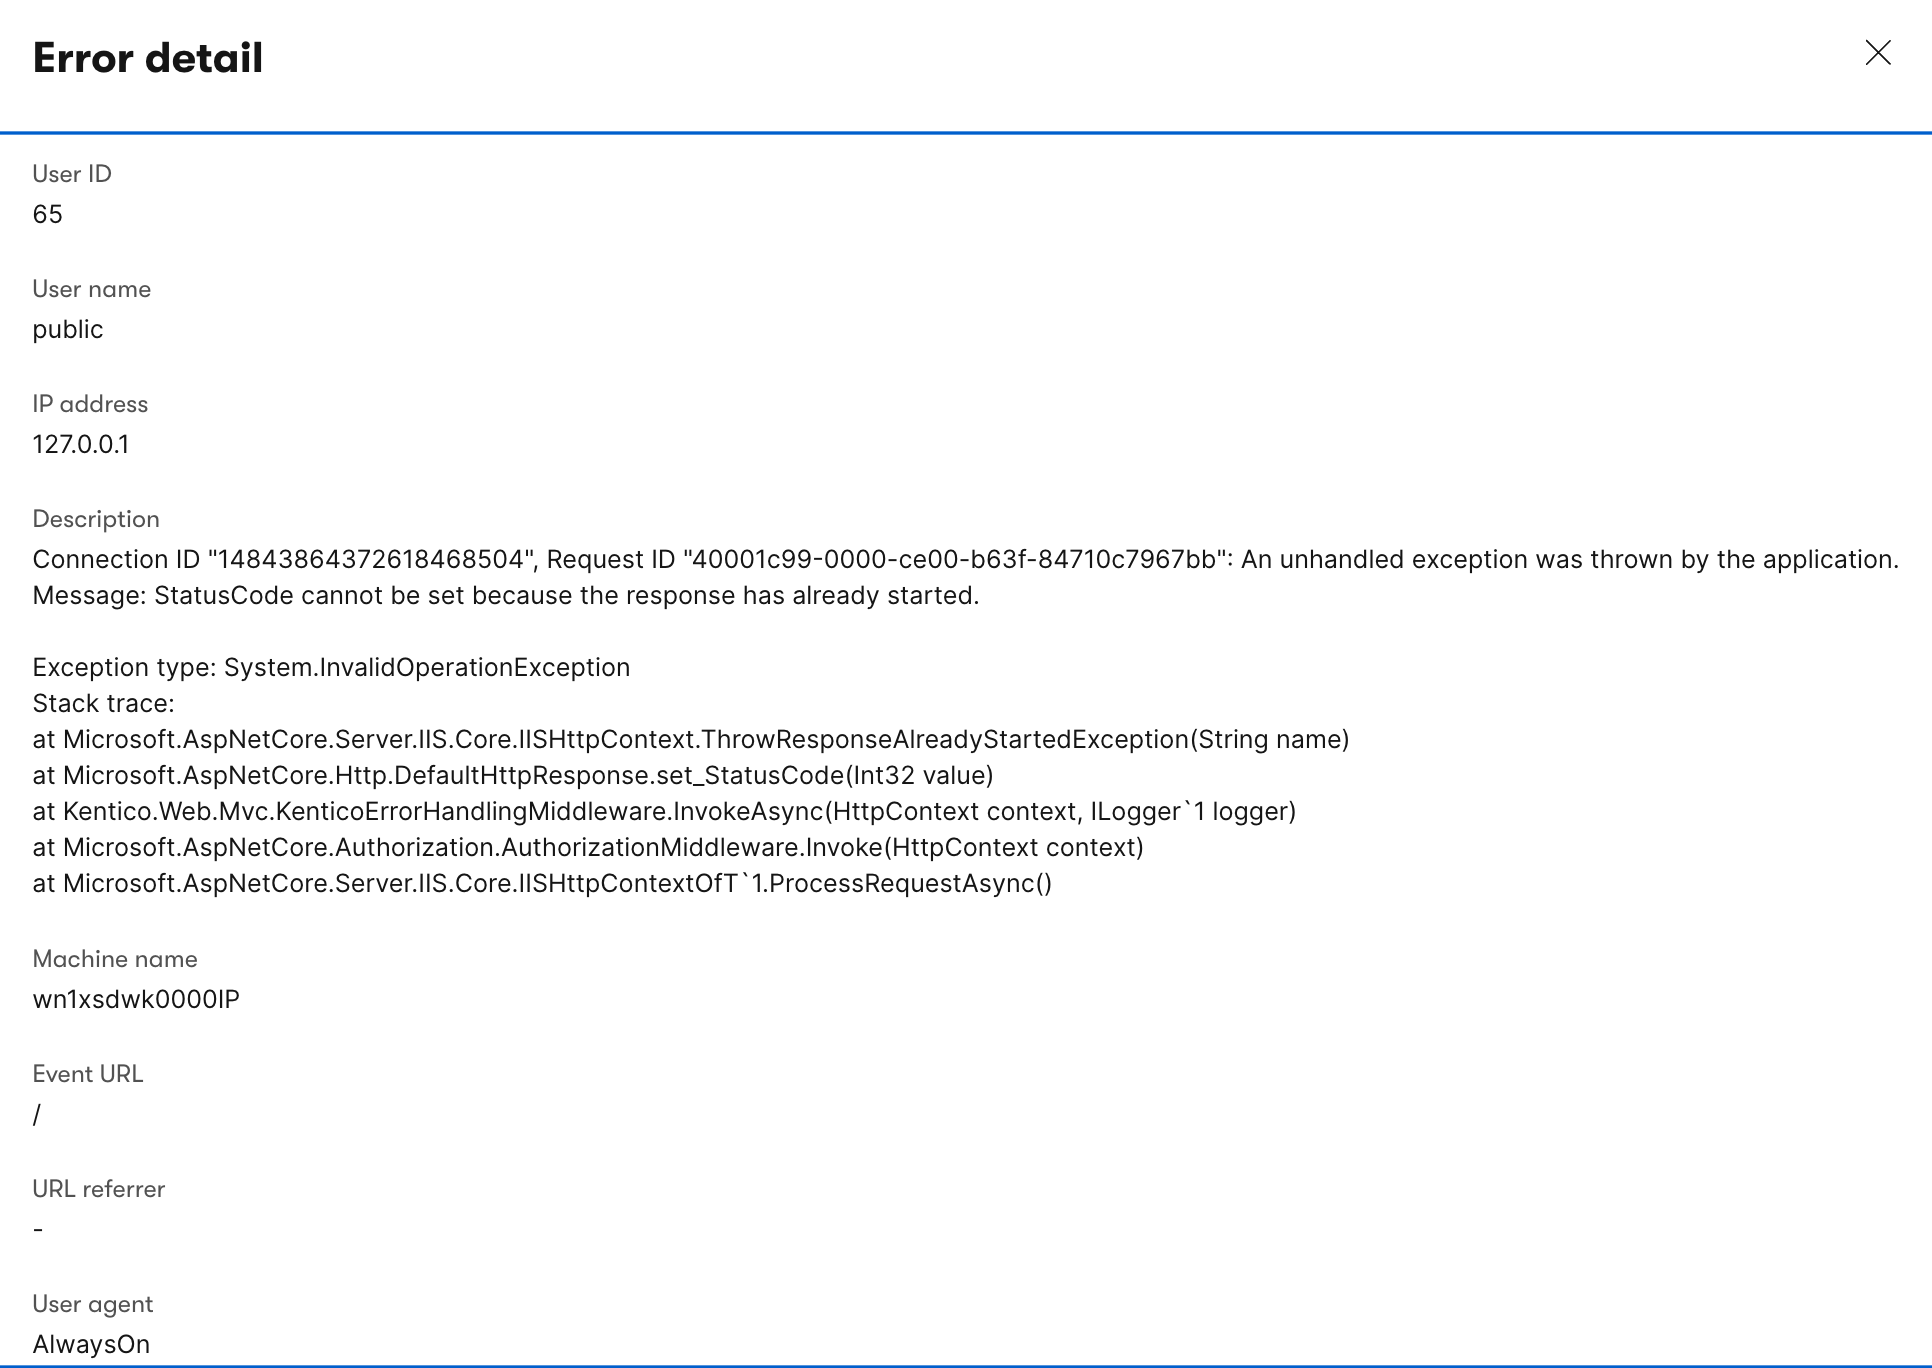
To provide a specific example of the issue I am currently facing, the error message reads: StatusCode cannot be set because the response has already started. Please see the attached logs from ApplicationInsights and the Event Log. I reviewed the Git history to check for any commits that could have caused this issue around the time it started appearing in the logs, but I found no relevant code updates. I am unable to reproduce the error, but it seems to occur mostly with requests related to the "AlwaysOn" functionality.

I would be pleased if you have any tips and tricks for further investigation.

Environment

  • Xperience by Kentico version: [29.3.3]
  • .NET version: [8]
  • Deployment environment: [SaaS]

Answers

September 12, 2024 1:09 PM

The StatusCode cannot be set because the response has already started issue has been fixed in v29.4.3.


September 1, 2024 1:58 PM

When I see issues that appear only for the deployed version of an application I investigate in a few areas

  1. Infrastructure configuration
  2. Release vs Debug builds
  3. Race conditions

You can rule out #2 by doing a Release build locally and "deploying" the app on your machine with a dotnet publish - more specifically the prep steps you take to build your SaaS deployment package.

It's more difficult to test #1, especially since you don't manage the infrastructure for SaaS but I also don't think this is a likely cause.

For #3 you can look for code that uses Task/Task<T> but hasn't been await'd or it is await'd in a different order than it was executed. ASP.NET Core middleware and Controller/endpoint code is the most common place to find Task based race conditions.

The reason the race conditions show up when the application is deployed is because the execution speed, single request nature of localhost hides a lot of problems. Also middleware based race conditions can also be related to #2 in the list above since some middleware paths are only executed in Release mode.


September 1, 2024 9:24 PM

Thanks Sean so much for your quick response! I’ve spent hours trying to apply your general suggestions to my case and investigating further. Unfortunately, I haven’t had much luck so far. Here are some specific thoughts based on your suggestions:

  1. You’re right—it’s impossible to simulate Kentico’s SaaS environment locally, so I don’t think that approach will work.

  2. At some point, I was able to “deploy” and run the site in a local folder using Visual Studio on my Windows machine. However, I couldn’t reproduce the issues in this setup. Even if I could, I’m not sure how I would identify the source of the error since it runs compiled code.

  3. I manually reviewed the entire codebase for potential issues, and I also used the Parallel Checker extension for VS (https://github.com/blaeser/parallelchecker), but nothing came up.

Regarding the specific issue of the StatusCode cannot be set because the response has already started., I tried removing most elements from the _Layout.cshtml file to limit any problematic code and redeployed to the SaaS environment, but still no luck, the issue is still there. I also removed custom middlewares and checked whether order of XbyK-related middlewares is correct. No luck. I did notice that I’m able to reproduce the issue in the Admin > Channels > Website Channel when quickly navigating between Preview and Page Builder. The issue started appearing in the logs on August 26th. Around that time, I only made some CSS updates and cleared a few unused references to external NuGet packages. Is there any chance that this might XbyK-related issue? I am a bit desperate here.


September 3, 2024 6:00 PM
  1. Can you reproduce it with an unmodified Dancing Goat or SaaS starter solution? If not, then it could be an infrastructure (networking, Azure) issue.
  2. Is the issue customer facing / does it impact the website presentation or is it only causing errors in the Event Log?
  3. When you say you are able to reproduce it when you quickly switch back and forth from the Page Builder to Preview tabs for a page, do you see an error in the UI or only in the Event Log?
  4. What SaaS tier is the solution using?
  5. Can you reproduce it in QA/UAT and PROD in SaaS?
  6. Have you tried updating to v29.4.x?
  7. The "AlwaysOn" setting of the App Service is abstracted away (along with all the other App Service settings) and I haven't seen reports of this issue with other SaaS customers, nor have I seen it with the Community Portal. "AlwaysOn" just means the App Service pings itself at the application root every ~5 minutes.

September 4, 2024 7:46 AM

Thank you, Sean, for your efforts in investigating this issue further. I really appreciate it.

  1. Since this issue only occurs in the SaaS environment and not locally, I don't have the option to try to reproduce it anywhere other than on the affected client's site. Unfortunately, there are no available slots in the SaaS account to set up additional sites. I hope that makes sense.
  2. The error is only appearing in the Event Log and Exceptions page in Xperience Portal. It's not visible in the Page Builder or on the live/preview site.
  3. Same as point 2.
  4. The environment is on a Standard tier, most likely Level 1.
  5. I can only reproduce the issue in SaaS, in both QA and PROD environments.
  6. No updates have been made yet, as we are currently in a freeze period while we finalize the site to go live soon.
  7. In our case, I see the error occurring in the content of the "AlwaysOn" request approximately once an hour.

The logs are now filled with this issue since it gets logged at least once an hour. Once the site is live, I'm concerned that we might see this error more frequently as more visitors access the site. Additionally, I'm worried this error could potentially lead to more serious problems in the future. This is why I would like to investigate it further and, if possible, find a fix. Resolving this would also help prevent similar issues in future projects. I apologize if I sound a bit direct about this, but given that I can only reproduce the issue in the SaaS environment—which is somewhat of a black box to us—I don't see any other option. Regarding my communication with the consulting team, they have promised to reach out to the Cloud team to see if they can investigate this further on their end.


September 4, 2024 1:34 PM

Hi Milan, thank you for reporting this issue, it's a bug on our side and we're currently working on a fix.

I'll keep you posted, when the fix is released.


September 4, 2024 5:21 PM

Hi Peter,

I'm glad to see progress on this and that you were able to reproduce the issue! Hopefully, a fix is on the way soon.

I did spend around 15 hours trying to track down the problem on my end and had to be quite vocal to get the right support, so I'm relieved we're moving forward.

Could I also ask you to look into another error? This one also only occurs in SaaS environments, both in QA and PROD. It seems to be logged only during the first request after a deployment finishes. I'm sharing the logs below for reference.

From the Exceptions tab in Xperience Portal:

From Event log:

Thanks so much for your help!


September 4, 2024 5:28 PM

I believe those Antiforgery exceptions are caused by key rotation during deployments? (or something like that).

If you are logged into the admin and the admin auth cookie is not expired but no longer valid (because the application was redeployed), then you'll see this exception.

I've actually disabled this exception in the Community Portal because it's just noise most of the time.

You can disable it for this specific scenario by adding the following to your appsettings.json

{
  "Logging": {
    "LogLevel": {
      //...
    },
    "KenticoEventLog": {
      "LogLevel": {
        "Default": "Error",
        "Microsoft.AspNetCore.Antiforgery": "Critical",
		// ...
      }
    }
  },
  // ...
}

September 4, 2024 6:48 PM

So, just to confirm, these aren't really an issue, and it's safe to mute the error log?

Thanks for the tip about the appsettings.json file! It did mute the issue in the Event log, but as expected, the error still shows up in the Exceptions tab.


September 10, 2024 12:01 PM

So, just to confirm, these aren't really an issue, and it's safe to mute the error log?

That's how it looks in the ASP.NET Core source code.

try
{
    var serializedToken = _tokenStore.GetCookieToken(httpContext);

    if (serializedToken != null)
    {
        var token = _tokenSerializer.Deserialize(serializedToken);
        return token;
    }
}
catch (Exception ex)
{
    // ignore failures since we'll just generate a new token
    _logger.TokenDeserializeException(ex);
}

I assume they throw so an interested party could catch and inspect.

You could try adding the log level configuration for antiforgery to the overall application logs and see if that turns them off for the Xperience Portal as well.

{
  "Logging": {
    "LogLevel": {
	  // ...
      "Microsoft.AspNetCore.Antiforgery": "Critical"
    },
}

Also, your original StatusCode error issue should be resolved in an upcoming hotfix.


To answer this question, you have to login first.